
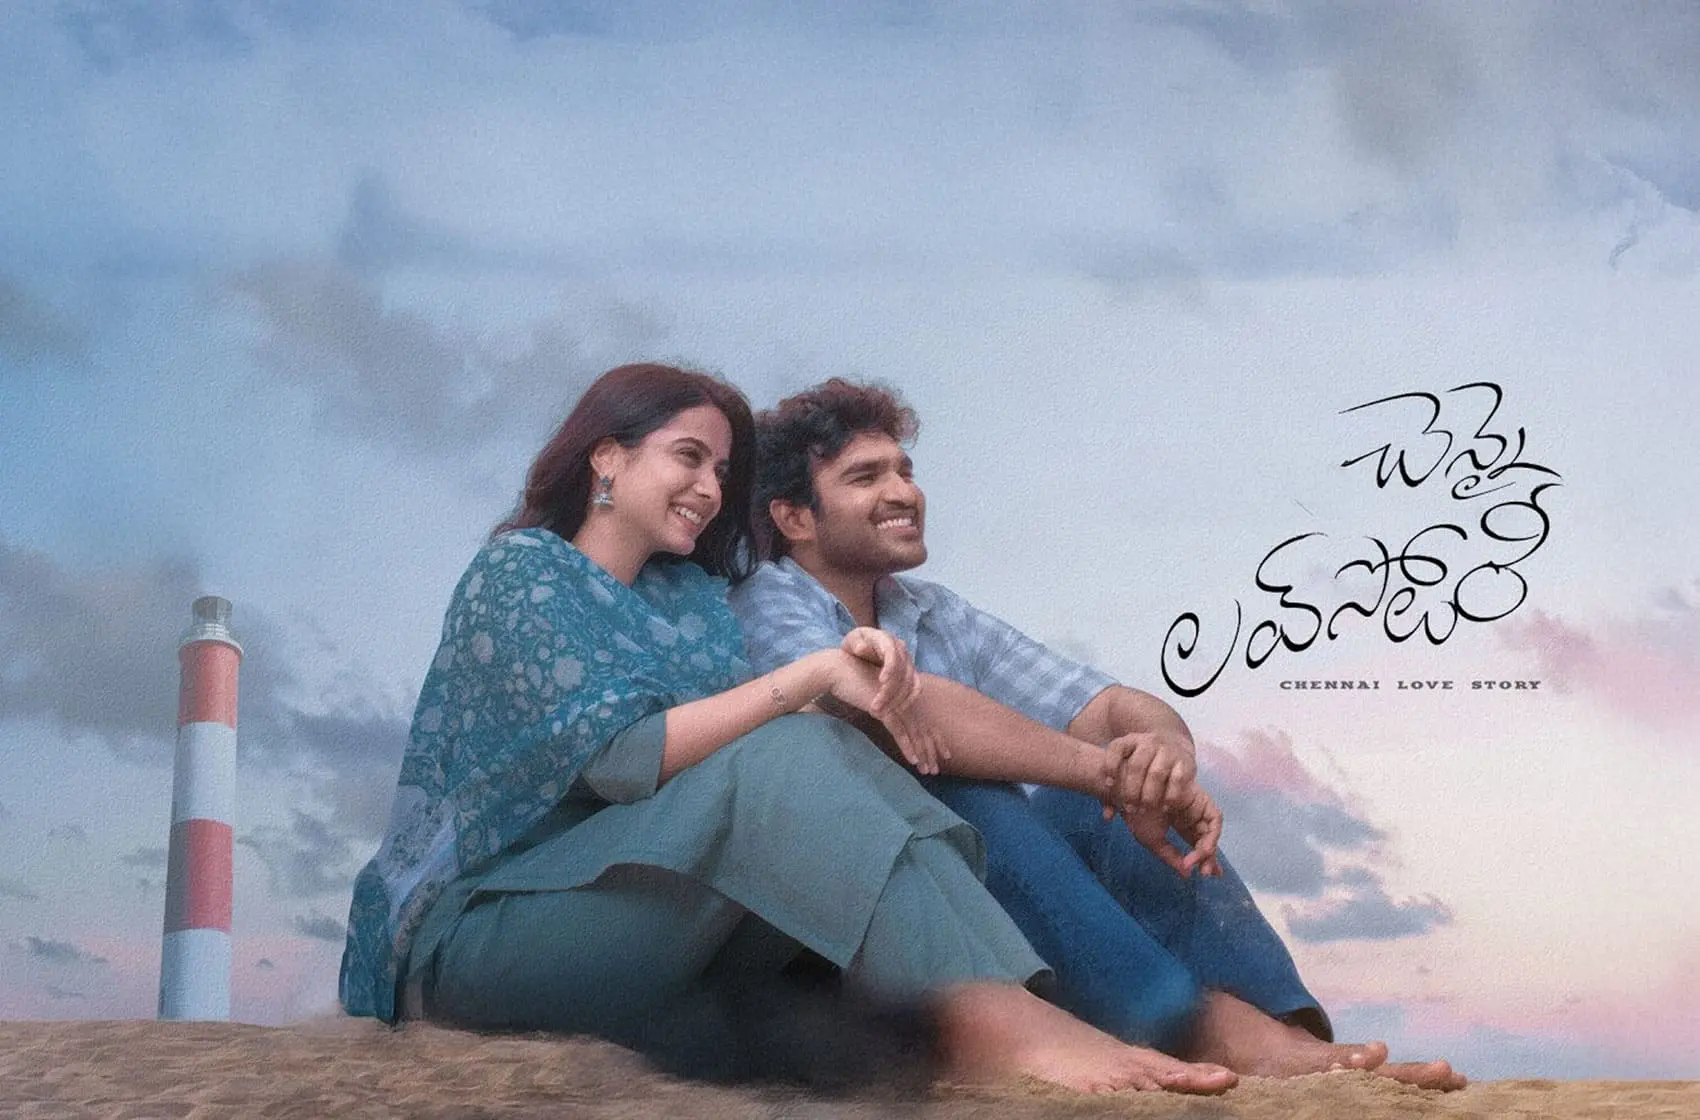
Chennai Love Story box office collection Day 17: ₹49.41 L on Sunday, 9 Aug 2026 from 584 shows across 121 cities at 19.0% occupancy. Total ₹39.25 Cr.
These are the final figures for Day 17.
The film played across 226 theatres, with 3 housefull and 52 fast-filling shows.
Compared to Day 16’s ₹38.76 L, Day 17 finished 27.5% higher in India-tracked gross.
Day 17 takes the cumulative India-tracked gross for Chennai Love Story to ₹39.25 Cr over 17 days of its theatrical run.
Collection Milestones
The cumulative India-tracked gross crossed ₹10 Cr on Day 2 (25 Jul 2026), then ₹25 Cr on Day 6 (29 Jul 2026).
Biggest Day So Far
Day 3 remains the film’s best day with ₹6.70 Cr, taken on 26 Jul 2026.
Week-wise Performance
Week 1: ₹26.35 Cr, Week 2: ₹11.09 Cr. Week 2 held 42.1% of Week 1’s total.
Weekend vs Weekday
Weekend days have brought in ₹18.14 Cr against ₹20.49 Cr on weekdays — 47.0% of the run’s gross from 6 of its 17 days.
Footfalls and Ticket Pricing
2,722,803 tickets have been sold to date, putting the average ticket price at ₹144.
For the complete day-wise breakup including city-level, state-level, and language-wise splits, visit the full collection page: Chennai Love Story — Box Office Collections.
Day 17 Collection Summary
| Metric | Day 17 |
|---|---|
| Gross Collection | ₹49.41 L |
| Tickets Sold | 37,206 |
| Shows | 584 |
| Theatres | 226 |
| Cities | 121 |
| Occupancy | 19.0% |
| Housefull Shows | 3 |
| Fast-filling Shows | 52 |
Day-wise Collection
| Day | Date | Weekday | Gross (₹) | Change | Tickets | Total (₹) |
|---|---|---|---|---|---|---|
| Premiere | 23 Jul 2026 | Thu | ₹62.54 L | — | 33,169 | ₹62.54 L |
| Day 1 | 24 Jul 2026 | Fri | ₹4.07 Cr | +551.0% | 272,122 | ₹4.70 Cr |
| Day 2 | 25 Jul 2026 | Sat | ₹5.63 Cr | +38.3% | 357,188 | ₹10.33 Cr |
| Day 3 | 26 Jul 2026 | Sun | ₹6.70 Cr | +19.0% | 433,893 | ₹17.03 Cr |
| Day 4 | 27 Jul 2026 | Mon | ₹3.15 Cr | -53.0% | 219,978 | ₹20.18 Cr |
| Day 5 | 28 Jul 2026 | Tue | ₹2.88 Cr | -8.4% | 208,321 | ₹23.06 Cr |
| Day 6 | 29 Jul 2026 | Wed | ₹2.35 Cr | -18.4% | 168,691 | ₹25.41 Cr |
| Day 7 | 30 Jul 2026 | Thu | ₹1.56 Cr | -33.6% | 113,404 | ₹26.98 Cr |
| Day 8 | 31 Jul 2026 | Fri | ₹1.66 Cr | +6.5% | 120,641 | ₹28.64 Cr |
| Day 9 | 1 Aug 2026 | Sat | ₹2.26 Cr | +35.7% | 154,036 | ₹30.90 Cr |
| Day 10 | 2 Aug 2026 | Sun | ₹2.66 Cr | +17.9% | 187,466 | ₹33.56 Cr |
| Day 11 | 3 Aug 2026 | Mon | ₹1.24 Cr | -53.6% | 99,957 | ₹34.80 Cr |
| Day 12 | 4 Aug 2026 | Tue | ₹1.15 Cr | -6.9% | 93,416 | ₹35.95 Cr |
| Day 13 | 5 Aug 2026 | Wed | ₹1.10 Cr | -4.1% | 90,217 | ₹37.06 Cr |
| Day 14 | 6 Aug 2026 | Thu | ₹1.01 Cr | -8.4% | 84,231 | ₹38.07 Cr |
| Day 15 | 7 Aug 2026 | Fri | ₹29.84 L | -70.5% | 22,670 | ₹38.36 Cr |
| Day 16 | 8 Aug 2026 | Sat | ₹38.76 L | +29.9% | 26,197 | ₹38.75 Cr |
| Day 17 | 9 Aug 2026 | Sun | ₹49.41 L | +27.5% | 37,206 | ₹39.25 Cr |
| Total | ₹39.25 Cr | — | 2,722,803 | ₹39.25 Cr | ||
Top Cities — Day 17
| # | City | Gross (₹) | Share | Tickets | Shows | Occupancy |
|---|---|---|---|---|---|---|
| 1 | Hyderabad | ₹9.07 L | 18.4% | 4,369 | 67 | 29.0% |
| 2 | Vizag | ₹5.10 L | 10.3% | 3,678 | 52 | 21.5% |
| 3 | Vijayawada | ₹2.28 L | 4.6% | 1,487 | 25 | 25.8% |
| 4 | Eluru | ₹2.04 L | 4.1% | 1,511 | 8 | 70.2% |
| 5 | Bengaluru | ₹2.03 L | 4.1% | 867 | 12 | 26.9% |
| 6 | Palvancha | ₹1.39 L | 2.8% | 1,704 | 4 | 60.6% |
| 7 | Khammam | ₹1.03 L | 2.1% | 984 | 4 | 26.9% |
| 8 | Nellore | ₹89,478 | 1.8% | 575 | 11 | 31.1% |
| 9 | Proddatur | ₹80,250 | 1.6% | 535 | 4 | 23.0% |
| 10 | Kakinada | ₹78,146 | 1.6% | 564 | 9 | 20.7% |
Disclaimer: The figures reported here represent India-tracked gross collections across participating chains and venues. The actual total gross may be slightly higher than or approximately equal to what is reported here, as final numbers can vary when late reports are reconciled.